Ripple (XRP) Price Analysis - February 17, 2021
Shine Li Feb 17, 2021 08:48
Despite breaching the psychological barrier of $0.50, Ripple (XRP) is struggling to retain its spot among the top five biggest cryptocurrencies in the market.
As positive sentiment surrounds the cryptocurrency sector at the moment, altcoins have benefitted and surged higher. Despite breaching the psychological barrier of $0.50, Ripple (XRP) is struggling to retain its spot among the top five biggest cryptocurrencies in the market. Currently, Cardano (ADA) has surpassed it.

Since the Securities and Exchange Commission (SEC)’s lawsuit against Ripple Labs, XRP’s volatility has been high. However, despite a decrease in its trading volume, XRP’s price has managed to afloat and even break past the $0.50 level. Here is a deeper look into what may be in store for XRP.
XRP/USD
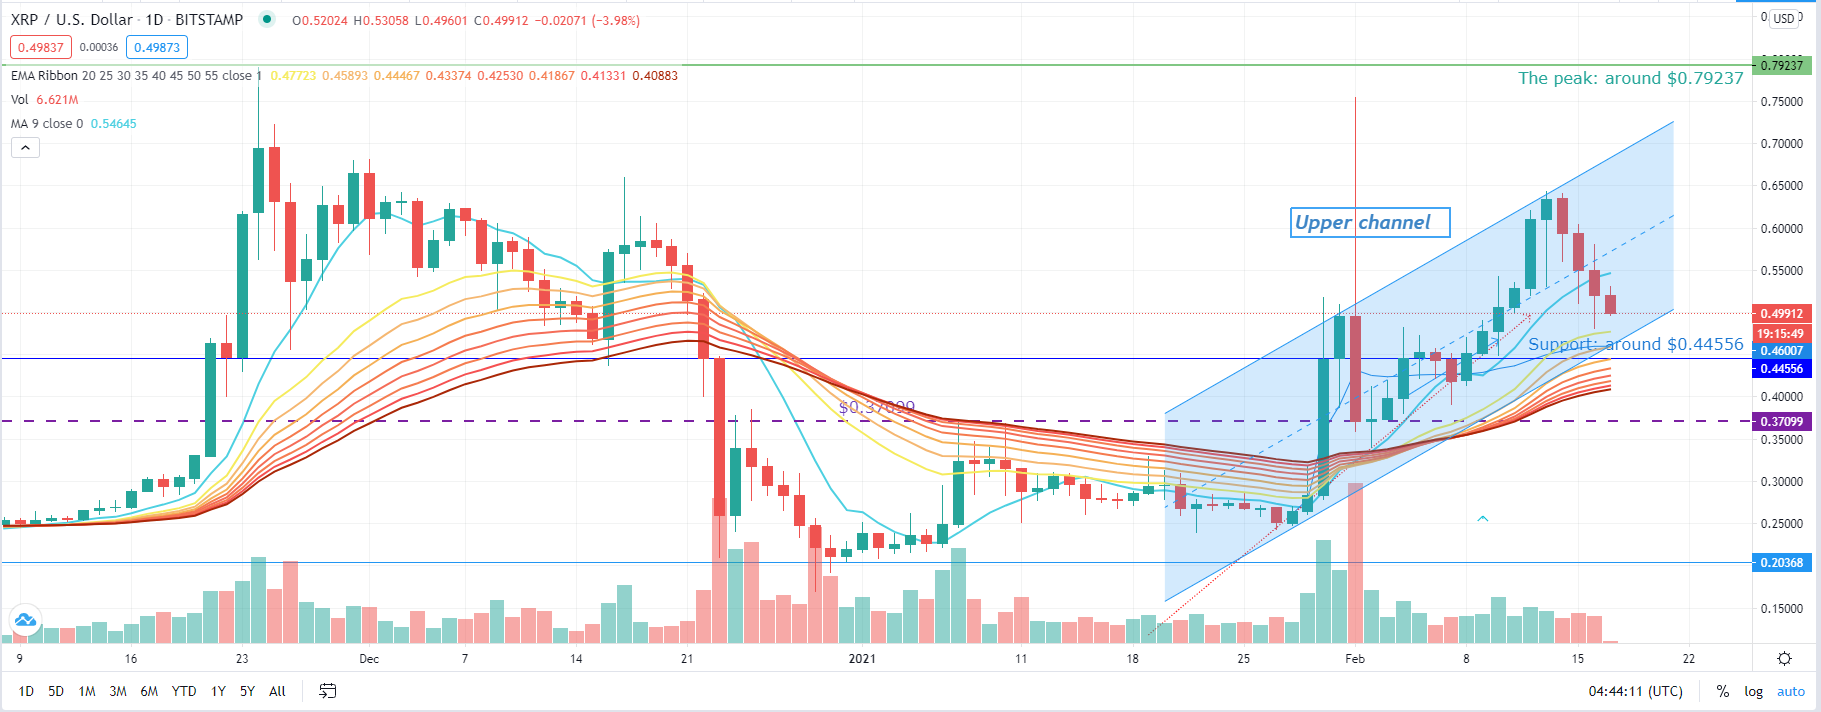
Source: XRP/USD via TradingView
Judging from the daily chart of XRP, the cryptocurrency encountered strong resistance on February 14 and was unable to break through the upward pressure line of the entire ascending channel. It fell from the resistance level of $0.65 after touching it momentarily and currently it is testing $0.50 and trying to turn it into a support level. XRP’s price is still in the ascending channel at the moment, meaning it has the potential to surge higher.
The 20-day exponential moving average ($0.47762) will be an important support. If the price drops from the 20-day moving average, the currency pair may test a lower support level of $0.44556 and fluctuate between $0.47762 and $0.44556 as it consolidates. If the price falls below this level of $0.44556, XRP may retest $0.37099.
At the same time, if the bulls can push the price above $0.65 and bring the volume to break the pressure line of the upper channel, XRP/USD may rebound to the previous highest point of around $0.79237.
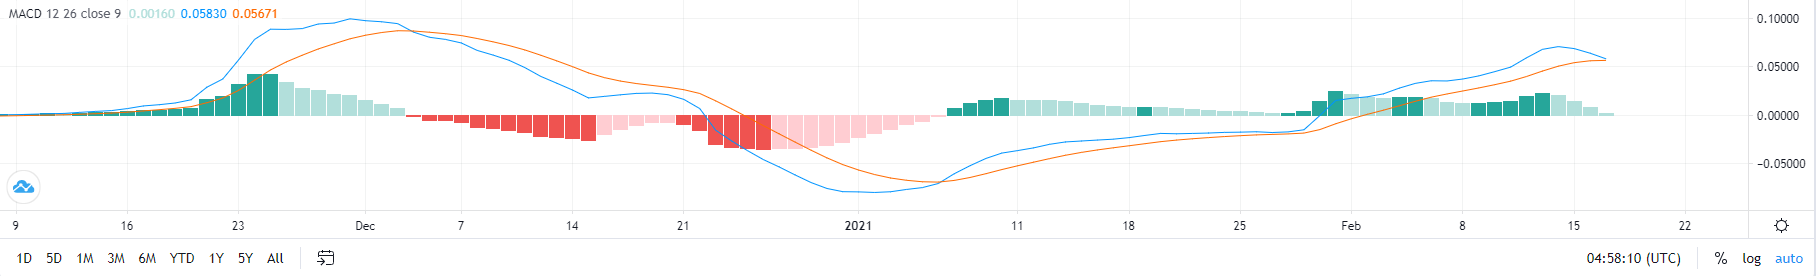
Source: XRP/USD daily chart via TradingView
It can be seen from the MACD chart that the blue line has begun to turn downstream and is approaching the yellow signal line, which has almost merged together with the blue line. This shows a shrinking state for XRP as its transaction volume has slowly been decreasing. This is a precursor to the formation of a cross and would show a short-term bearish market.
Image source: Shutterstock