Bitcoin 2019 Yearly Overview - Price Movements, Advancement and Adoption
Geoffrey Gardiner Dec 26, 2019 08:00
The rise and fall of Bitcoin in 2019, with information on price. adoption and what 2020 could hold.

The Journey of Bitcoin
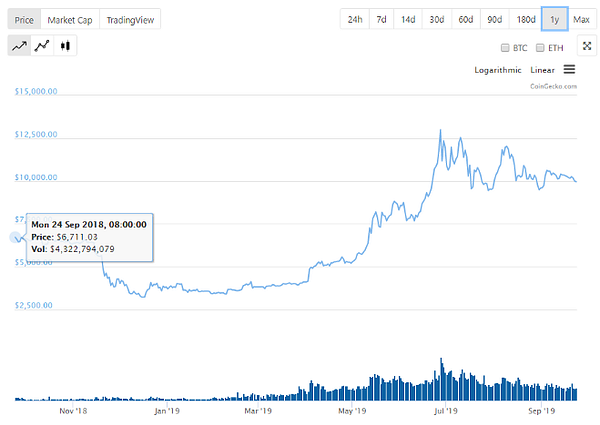
On September 24th, 2018, an entire year ago, the BTC market stood below 7,000 USD. What has happened since?
10 Key elements - Price movements
- 6000 USD | 3,200 USD
In early June 2019, BTC suffered a huge loss dropping the market over 50% in value.
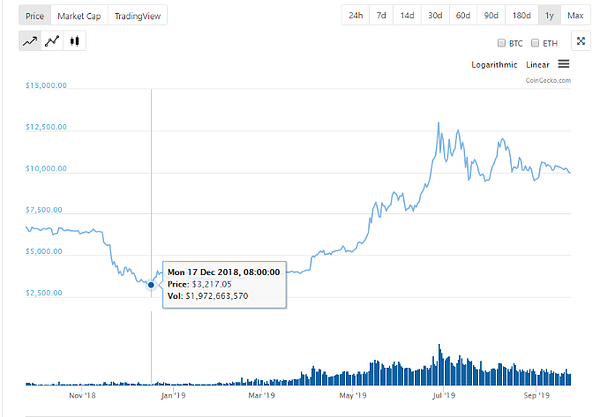
2. 3,500 USD Bear Market
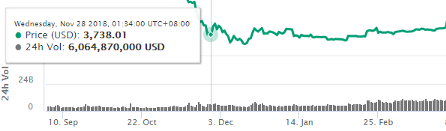
From November 2018 until April 2019, Bitcoin was in a long bear market. BTC staying below 4000 USD for the entire 6 month period.
3. 2019 Quarter year Market breaks out
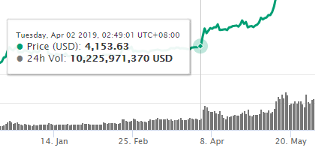
Between April 1st and 4th, the market broke out and for the first time in 6 months showed signs of life. Moving to 5,000 USD in a matter of 3 days.
4. 2019 Extended bull market
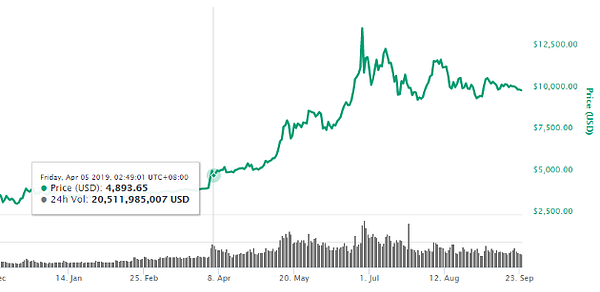
Continuing in April until June 27th, the market grew at a quick pace. Finally reaching a yearly high of 13,729 USD in July.
5. 2019 Market top and drop
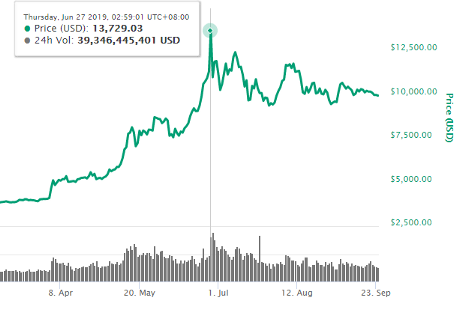
The Market peaked and immediately dropped to 11,000 USD. Within June and July, the price corrected many times moving between 9,000 USD and 11,000 USD.
6. 10,000 USD stability
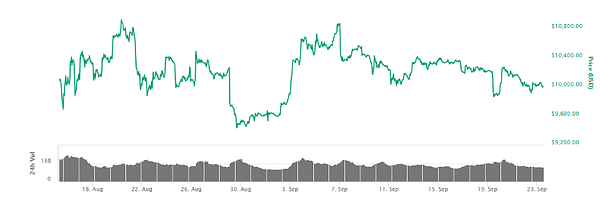
Bitcoin 10k range is reached.
From August 15th to September 23rd, the market stayed within the 10,000 USD range. Some breakouts getting close to 11,000USD and dips falling to 9,400 USD.
7. October tests 8,000USD
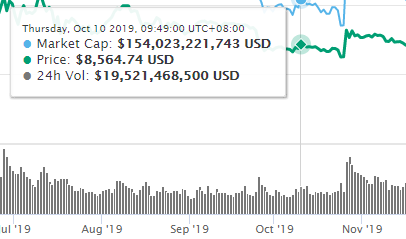
October started testing where BTC would ultimately fall to. The market held between 8–9,000 USD, before a slight spike to 9,300 USD. Before then beginning a long but steady fall back down to lower levels.
8. Last Quater of 2019 Price chart
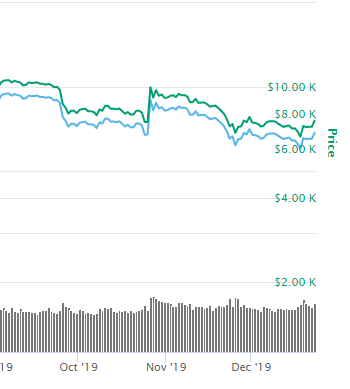
During the final 3 months of 2019, the market has been dipping closer to 6k levels with resistance pushing it up and down between the 6 and 7,000USD range.
9. Bitcoin in 2019
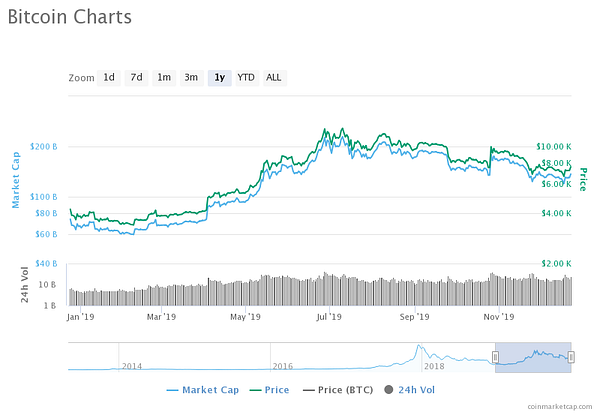
When looking at the year as an entirety, the market has risen from 3,000USD ranges in January to what is now a 6–7,000 USD range in December, boosting the market cap and prices by over 100%, in 12 months.
Price remains to be volatile but based on market movements, demand and interest continue to follow the digital currency.
10. Adoption
Who is accepting Bitcoin payments?
Globally there have been massive strides forward, with many major and well-known brands accepting and testing the Bitcoin Network. As reported on 99Bitcoins, KFC, Microsoft, Subway and AT&T all accept the digital currency for payment.
Online and in-store options are available for many smaller businesses as well, with huge lists of companies moving into the cryptocurrency settlement business.
Adoption has a long way to grow, but with year on year growth, among large and small businesses, it is a good sign that the technology has demand and room to expand.
No one can say what the future holds for BTC, but if it has another year of growth in all sectors like 2019, 2020 could be yet another good year for cryptocurrency’s Digital Gold.
Image via Shutterstock
Image source: Shutterstock