Weakening of CoinShares Capital Inflows Causes the Price of Bitcoin to Fall
Traders tried multiple attempts to push BTC to $60,000 but were rejected and failed to stabilize this level and fell sharply yesterday, reaching a minimum of $53,715.

Since Bitcoin (BTC) hit its all-time high (ATH) of $61,781 on March 13, the price of Bitcoin has been falling. Traders tried multiple times to push BTC to $60,000 on March 18 and March 20, but were rejected and failed to stabilize at this level. Bitcoin fell sharply yesterday, reaching a minimum of $53,715.

The Digital Asset Fund Flows Weekly report released by the digital asset management company CoinShares on March 22 wrote:
"We have also seen a decline in Bitcoin investment product trading volumes to $713 million per day last week, versus $1.1 billion per day for 2021."
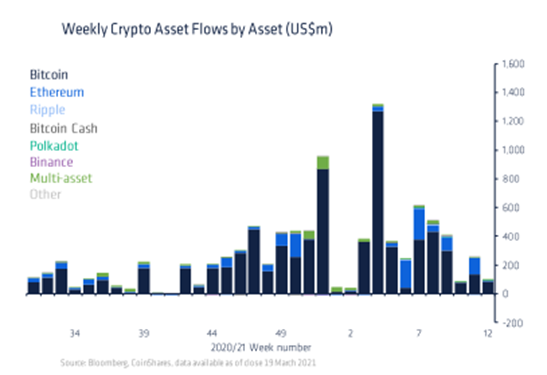
The report also pointed out that the capital flow data depicted regional gaps. The inflow of capital investments from the United States into Coinshares has been slowing down, while investments from Europe and Canada have been continuous and steady.
"Since the February price highs and heightened volatility, we have seen a steady decline in appetite amongst investors."
Bitcoin Price Analysis
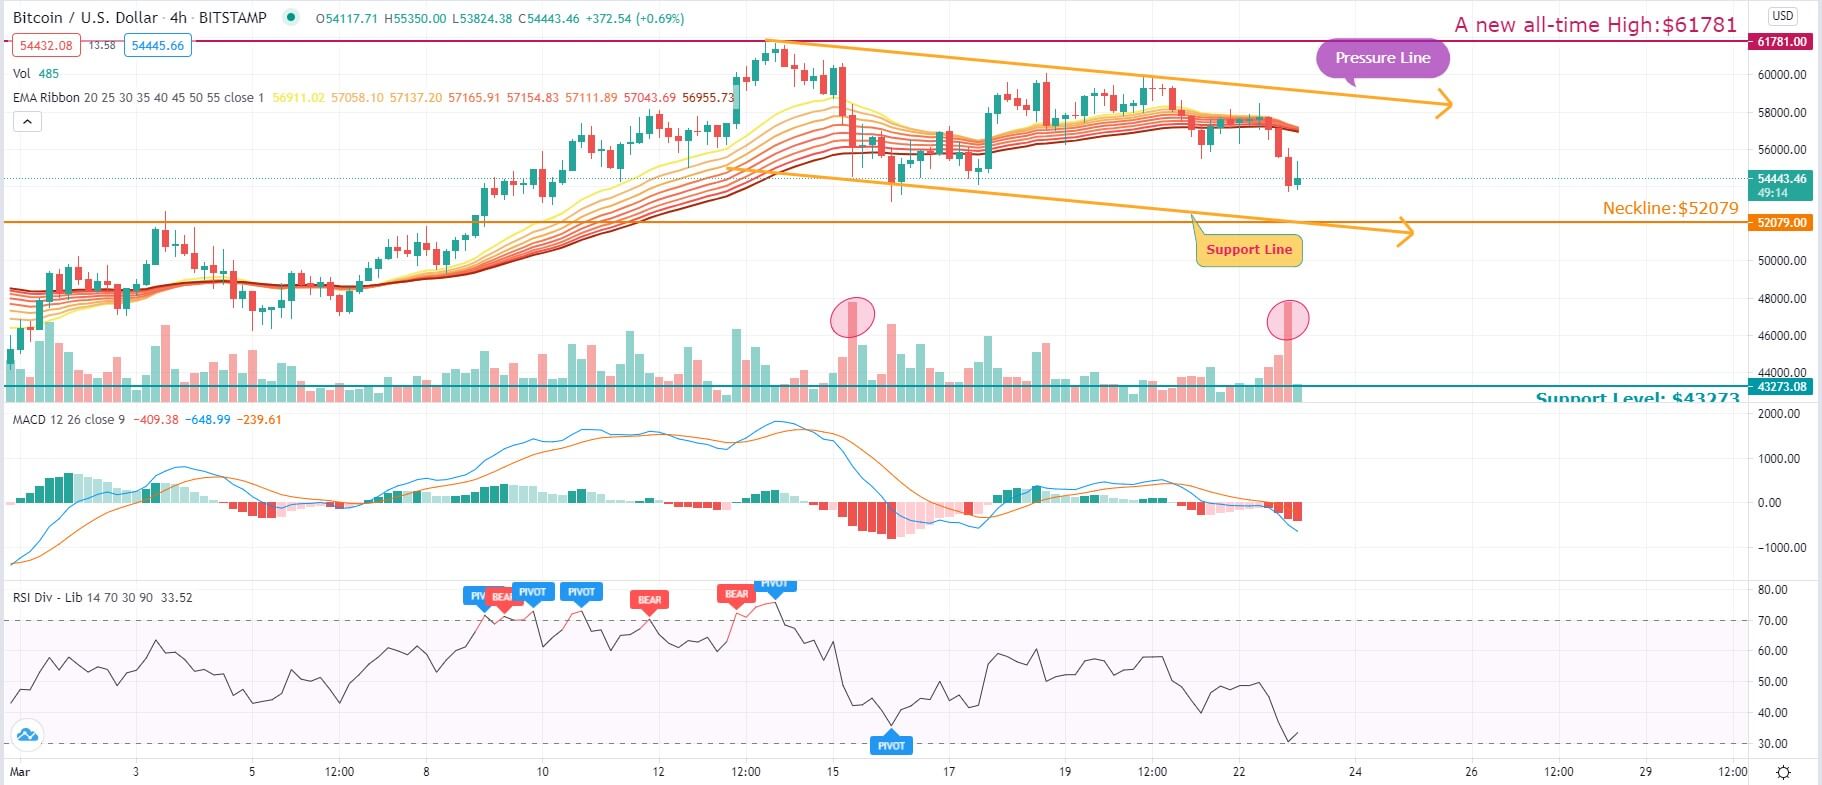
Source: BTC/USD 4-Hour via TradingView
The current BTC price has fallen back to the $54,000 support level. Currently, BTC is trading at $54,609 at the time of writing.
Judging from the 4-hour candlestick chart, currently BTC/USD has fallen below the exponential moving average ribbon. The volume of the last red bearish candlestick is very huge, not much different from the previous drop of $56,000 after its all-time of $61,781. History may repeat itself, and BTC/USD may consolidate in the $52,000-$55,000 area for some time. If BTC/USD does not manage to stabilize, then BTC/USD will continue to develop a downward trend and plummet to $52,079, which is a level that previously broke through the neckline of the inverted head and shoulders pattern.
If there is a stop-drop phenomenon, the resistance line drawn in the chart will hinder the rise of BTC. The first resistance level for Bitcoin is about $60,000. If the price rises from the current level and rises above $60,000, it may indicate that the cryptocurrency's upward trend has resumed. The all-time high of $61,825.84 may provide resistance.
The moving average is slightly slanted. The MACD indicator has formed a bearish crossover. The blue MACD and yellow signal lines both moved below the zero axes, indicating a bearish trend is looming and may potentially form.
The relative strength index (RSI) rebounded quickly when it touched the 30 oversold zone, which shows that at the moment, the bulls maintain a slight advantage.
Image source: Shutterstock