Uniswap (UNI) Price Analysis-March 19,2021
UNI is trading at $30.55, but it appears to be caught on a bearish trend. Currently, the bears are retesting the support level of $29.27.

Uniswap (UNI) seems to be suffering from repeated selling pressure from the bears. The bulls are actively defending the support level at the 20-ema level.

Uni currently ranks 8th among cryptocurrencies, with a market value of $15,702,895,948. UNI reached its all-time high of $34.93 on March 8, but failed to maintain its bullish momentum. However, Bitcoin soaring to $60,000 may help UNI bulls push Uniswap's price higher. However, if selling pressure results in UNI dipping below $29, it may be difficult for the bulls to maintain their upward momentum.
Uniswap(UNI) Price Analysis
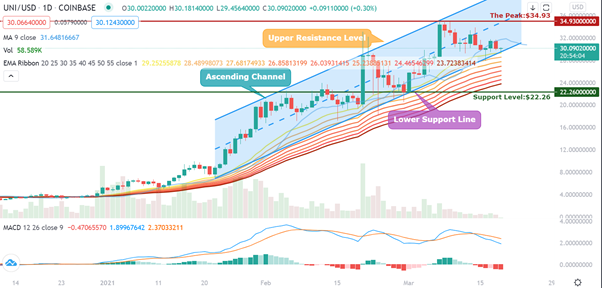
Source:UNI/USD Daily via TradingView
Judging from the daily Uniswap (UNI) candlestick chart, the long tail for the candlestick on March 16 showed that the bears were actively pushing the price down to the 20-day Exponential Moving Average(20-EMA), but the bulls were actively defending the support level of the 20-EMA. On March 17 and March 18, a green and a red candlestick of a similar size were displayed respectively, indicating that there was a fight between the bulls and the bears.
UNI is trading at $30, and the bears are retesting the 20-EMA of $29.27 support.
Currently, UNI is still in the ascending channel. If UNI stands at 20-EMA, it is very likely that UNI will fall out of the ascending channel. The bears pushed the price down to the 50-EMA level, which is approximately $24.50. If the bulls hold this support temporarily, then the next support level is $22.26.
If the price stays above the 20-day EMA, traders may be aggressively bullish.
The MACD has formed a crossover that appears to be momentum indicating that the bullish momentum has diminished. And there is no clear indication that a bullish crossover will be formed. The blue MACD line has been hovering below the yellow signal line even though both lines move on the zero axes.
Image source: Shutterstock