Uniswap Price Analysis - March 29, 2021
As the eighth-largest digital currency, Uniswap is likely to be restrained by short positions on the next trading day. Here is an analysis of what to expect of UNI in the short-term.

As the eighth-largest virtual currency, Uniswap with a market cap of $14,604,649,336, is likely to be restrained by short positions in the next trading day.

Uniswap is a decentralized finance protocol on the Ethereum network that is used to exchange cryptocurrencies. According to data from Eth Gas Station, Uniswap stands out among most Ethereum-powered cryptocurrencies as the largest gas user. In the past 30 days, a total of 2 million worth of Ethereum fees were used.
According to statistics from Crypto Fees, the decentralized exchange Uniswap is second place to Ethereum in terms of transaction fee volume. On a daily basis, the transaction fees on Uniswap average a total of $4.8 million, which exceeds the $3.14 Million recorded on the Bitcoin network.
Uniswap (UNI) Price Analysis
Since March 18, Uniswap (UNI) has climbed to a new all-time high (ATH) of $36.80. After touching its all-time high, UNI encountered strong selling pressure. The altcoin is shown a downward trend on the price chart and major corrective measures have been swept in. The current drawdown exceeds 20%.
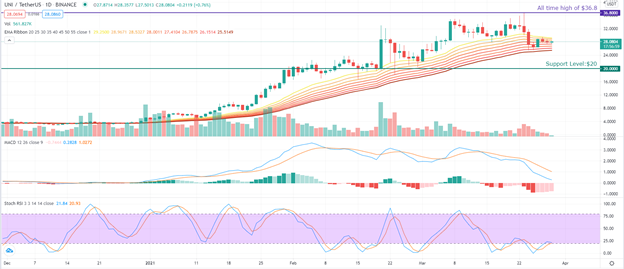
Source: UNI/USDT Daily via TradingView
UNI is making some repairs for the previous plunge, but it seems that the bulls are not strong enough. At the time of writing, UNI/USDT is trading at $28.11.
On March 27, the bulls tried to push the price above the 20-Exponential moving average, but they were conquered by the bears. Currently, the bulls are defending the 30-day Exponential Moving Average (30-EMA) and pushing UNI's price to $28.53.
If the UNI/USDT currency can surge to $28.53 (30-EMA), it will begin to move towards the Dnext resistance level of $29.25 (20-EMA). If UNI/USDT can successfully break through this resistance level, the bulls will eye to its all-time high of $36.80.
However, the MACD indicator that formed a bearish crossover and the stochastic RSI indicator that develops in the downward 20 oversold zones, suggest that this situation is unlikely to happen.
However, if UNI's price falls from the current level and breaks below the 50-EMA of $26.15, it may trigger further short selling. This may cause the price to fall to the next support level of approximately $20.
Image source: Shutterstock