Tezos Price Scoop: XTZ/BTC Bounces from Support as Indicators Show Exhausting Selling Pressure
On Tuesday, during opening trading hours, Tezos's price opened at 1898 satoshis, trading later at a gain of +3.96% at 1970 satoshis. Around 279 million worth of Tezos tokens exchanged hands of the volume during the trading session. Tezos is trading between a daily range of 1891 satoshis to 1985 satoshis.


On Tuesday, during opening trading hours, Tezos's price opened at 1898 satoshis, trading later at a gain of +3.96% at 1970 satoshis. Around 279 million dollars worth of Tezos tokens exchanged hands of the volume during the trading session. Tezos is trading between a daily range of 1891 satoshis to 1985 satoshis.
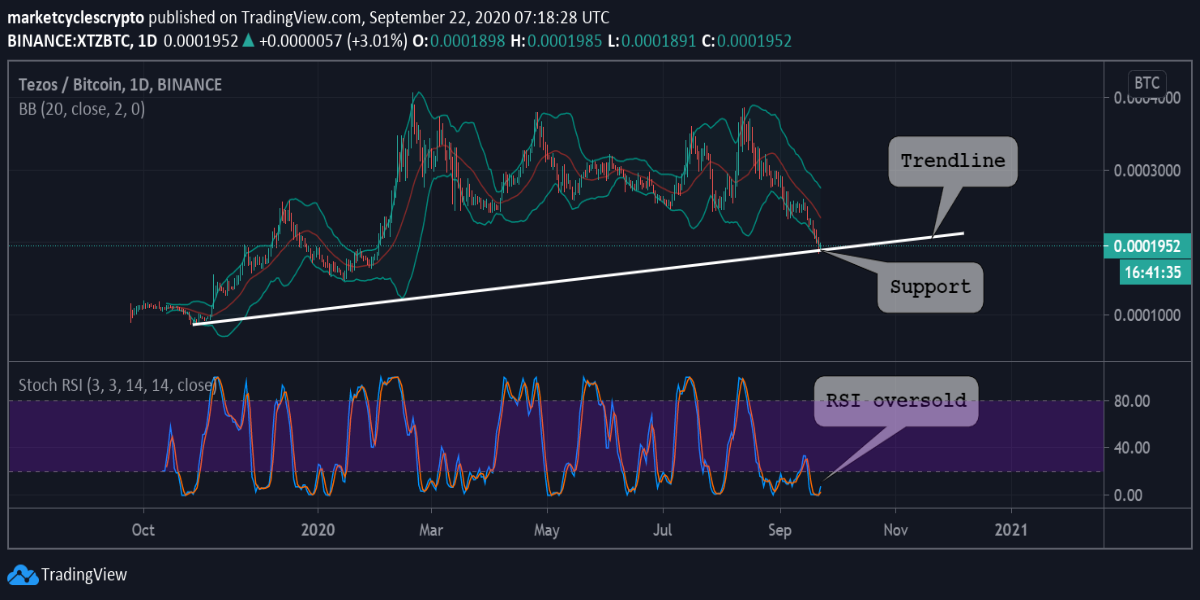
Stochastic RSI shows that XTZ/BTC is currently oversold. Indicating that the selling pressure has exhausted. The price also bounced from its support cementing trade setup with low risk and higher reward would likely result in gains for traders. The price is hitting a major trendline and is expected to hold the levels and is likely to move higher.
Source: Tradingview
Stochastic RSI has fallen to 0 level which indicates that Tezos price is currently extremely oversold. The price is resting on the support on 1 day, 4 hr chart and is likely to hold up. The price is also touching the lower bband indicating selling exhaustion and increasing the probability of a short term rally. The price on 1 day chart is in a descending wedge which can result in a price breakout if the support holds up.
Source: Tradingview
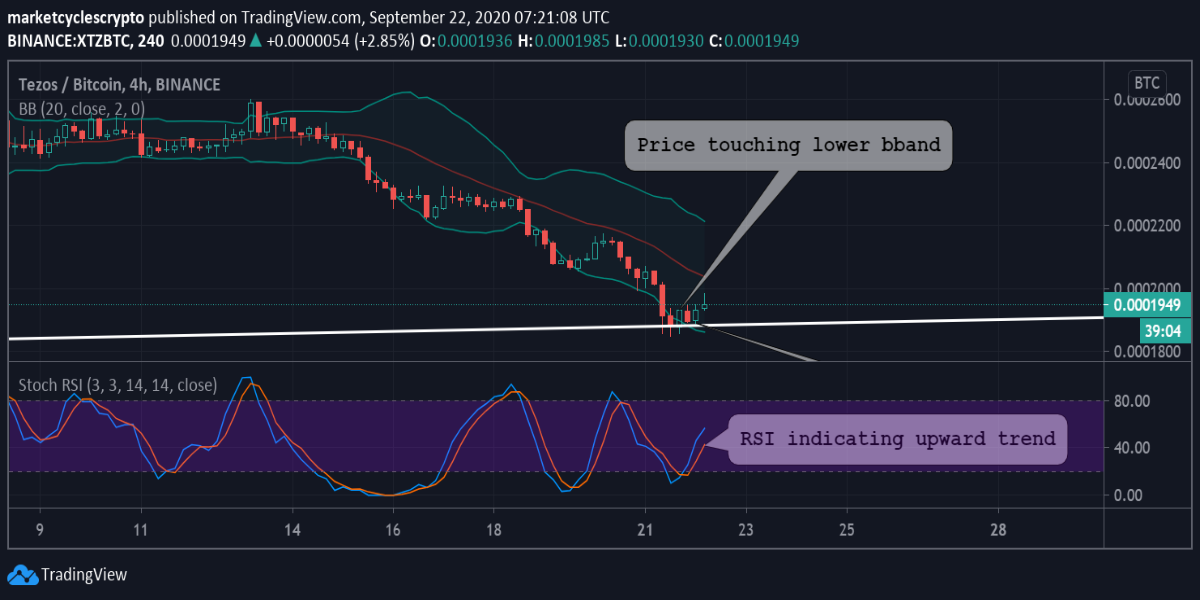
On the 4hr chart, the price has bounced from the support but is still ranging in a downward channel. If the residence is not broken then the support can be broken with continued selling pressure increasing on the market books. The RSI in the 4hr chart is moving upward indicating that we are going to see bull taking control here for a while. The price is also touching the lower bband which is indicating that a bounce from these price levels is highly likely.
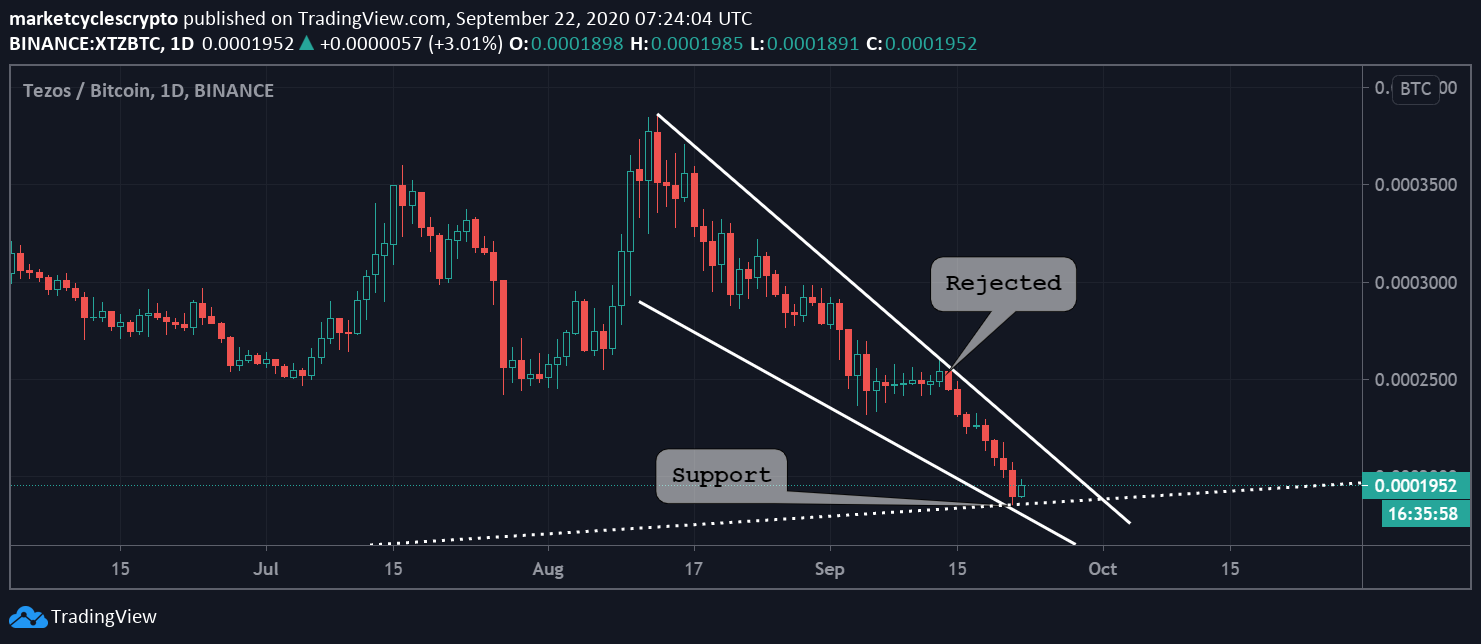
Source: TradingviewOn 1 day timeframe, the price is moving downward in a descending wedge. The price was rejected before when it tested the trendline of the descending wedge for a breakout but as we can see in the chart that right now the price is resting on major trendline support which reduces the risk of entering trade here but in crypto markets, supports like these haven broken multiple times after sustained selling pressure on the books.
Read more about Tezos.
Image source: Shutterstock