Polkadot (DOT) Price Analysis - April 21,2021
If the overall crypto market remains bearish, Polkadot (DOT) may follow the broader market trend and continue its current downward momentum, falling below the $30 mark.

Polkadot (DOT), created by the co-founder of Ethereum, Gavin Wood, aims to solve the problem of high gas fees experienced on Ethereum.

The Polkadot network provides a heterogeneous multi-chain interchange and translation architecture to connect private and consortium chains with public and permissionless networks.
Based on the Polkadot network and its "sister" test network Kusama, a new set of products will be launched on the market this month to build a decentralized and affordable DeFi.
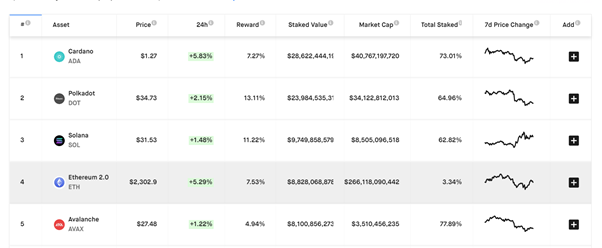
Source: StakingRewards
According to data from StakingRewards, Polkadot is currently the second-largest blockchain in terms of the staked value, worth about $24,074,650,618. Polkadot's pledge ratio is as high as 64.96%.
The largest crypto asset is locked in Cardano at $28,622,444,193, while its average annual staking reward (7.27%) is lower than DOT. Stakeholders of DOT could get a 13.11% reward every year.
Polkadot set a new all-time high of $49.20 on April 17. The bulls failed to sustain their bullish momentum. In the past few days, it suffered a large loss, from $49.20 to $34.33 today.
If the overall virtual currency market remains sluggish, DOT may follow the broader market and continue its current downward trend, falling below the $30 mark.
Polkadot (DOT) Price Analysis
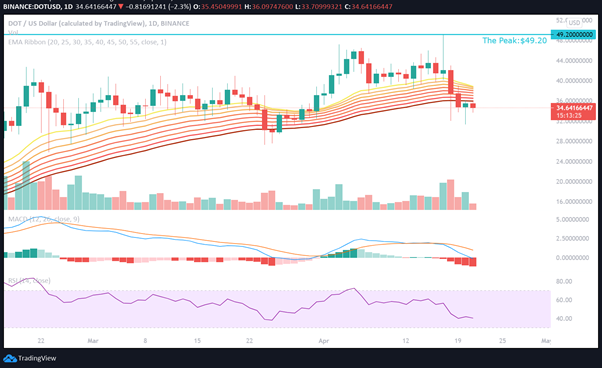
Source: DOT/USD Daily via TradingView
Polkadot (DOT) has suffered huge losses and the massive sell-off caused the price to fall by 21.66% within the past 7 days.
After the massive sell-off last weekend, the DOT rebounded yesterday, and the bulls worked hard to rebound the price from yesterday's $31.40 area to a daily high of $36.15. However, the bulls were unable to sustain the gains and quickly lost momentum, allowing the bears to control the market.
DOT/USD prices are moving under the Exponential Moving Average (EMA) ribbon. The MACD index is still in a bearish zone, indicating that it may sell further in the next few days. If the current trend continues, DOT may fall towards its 100-day Simple Moving Average of $30.75.
The RSI of DOT is $40.44, which is lower than the equilibrium point indicates that the bears are currently dominating the market. If the DOT fails to defend its support point at $31.40, the cryptocurrency may record further losses.
Contrary to this assumption, if the currency pair rebounds from the current level, it indicates strong buying on dips. DOT will seek to run at the 50-EMA of $36.55 resistance level. If the DOT's price can stand above the 20-EMA of $38.88, then the bulls will try to push the price to a record high of $49.20.
Image source: Shutterstock