Litecoin (LTC) Price Analysis – March 18, 2021
The price of Litecoin (LTC) successfully rebounded above $200, but it seems that it is currently suffering from strong selling pressure.

The price of Litecoin (LTC) successfully rebounded above $200. However, it seems that LTC is currently facing headwind and suffering from strong selling pressure.

LTC currently ranks 9th among cryptocurrencies, with a market value of $13,616,145,107. LTC has failed to continue soaring but Bitcoin's upward surge to $60K may help LTC bulls seek higher targets.
However, if the seller pushes the price below $200, it may be difficult for the bulls to maintain their upward momentum.
Litecoin (LTC) Price Analysis
Source: LTC/USD Daily via TradingView
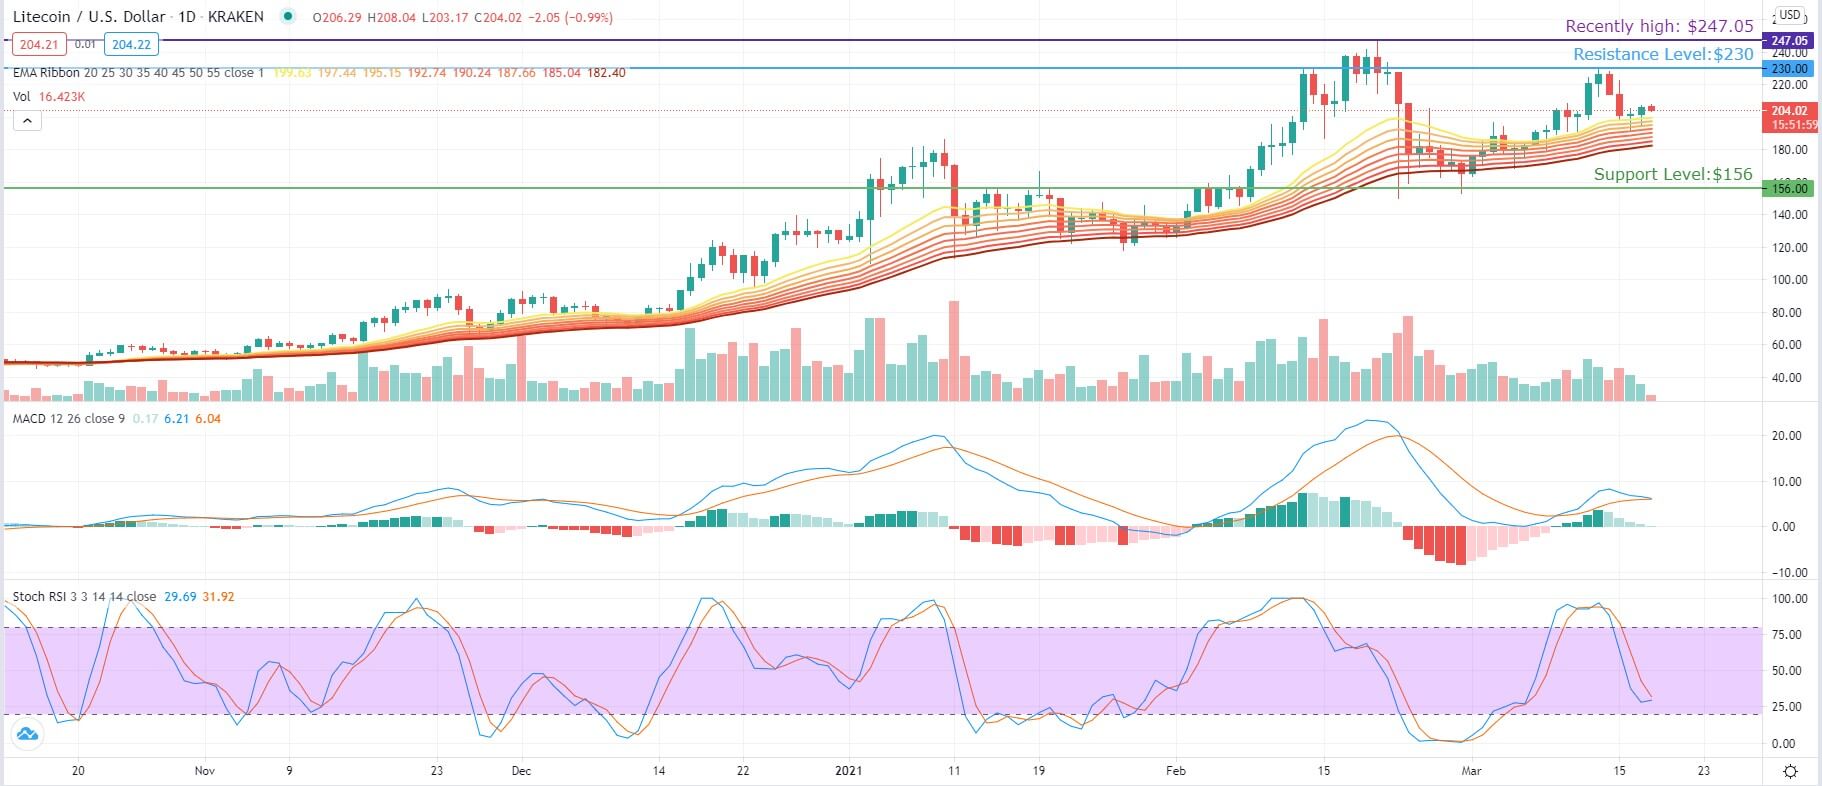
At the time of writing, LTC was trading at $203.93. According to data from CoinMarketCap, Litecoin's intraday trading volume decreased by 14.14% to $3,902,922,275. The reduction in trading volume may indicate a lack of enthusiasm for the bulls, allowing sellers to step up their attacks on the critical level of $200.
In the past 24 hours, the price of Litecoin has been fluctuating at around $200, and the bulls did not have enough power to increase the price and stand on the 20-day Exponential Moving Average.
If LTC/USD can be effectively supported at this level, then the next target will be the key horizontal resistance line of approximately $230. If it can successfully break through this level, it is very likely to hit its recent high of $247.05.
On the downside, if Litecoin falls below the $200 support, the upward trend will disappear. This move may attract more sellers and lower the price to $180.
The MACD index shows that the blue MACD line is downward and is close to the yellow Signal line. This is a signal that forms a short-term bear market crossover, even though both lines are above the zero axes.
The stochastic RSI index has also remained below the midpoint, indicating that the bearish pressure remains. However, from the graph, the blue K-line is reversing upwards. If there is a new buying order, the K-line will pass through the D-line from the bottom up, forming a golden cross. The two lines will move to the midpoint, and the price of LTC will usher in a new round of rising.
Image source: Shutterstock