February 18, 2021: Crypto Price Analysis for BTC, ETH, and DOT
As BlackRock has announced its intent to "dabble in Bitcoin", the cryptocurrency has continued its surge, along with Ethereum (ETH) and Polkadot (DOT).

The whole cryptocurrency market has been on a massive bull run lately. Altcoins have benefitted from Bitcoin’s current momentum. Things are looking good for the cryptocurrency industry, thanks to the wave of institutional investors purchasing and backing Bitcoin.

Currently, BlackRock asset management has announced its intention to diversify investments by buying Bitcoin. With $7.4 trillion assets under management (AUM) at the moment, BlackRock is the world's largest asset manager, according to lead crypto investor Dan Held. BlackRock's chief investment officer Rick Rieder told CNBC:
"Today, the volatility of Bitcoin is extraordinary, but listen, people are looking for storehouses of value. people are looking for places that could appreciate under the assumption that inflation moves higher and that debts are building, so we've started to dabble a bit into Bitcoin."
With the wave of institutional adoption pushing Bitcoin's price higher, the cryptocurrency is currently in a state of price discovery. Here is a look at which altcoins have also considerably surged in the past week, in tandem with Bitcoin's ascent to hit over $52K on the market.
BTC/USD
It can be seen from the candlestick chart of Bitcoin's 4-hour price that the current Bitcoin price has broken through the psychological level of $50,000 and continues to stand firm on this basis. This shows that the bulls are strong, and they are in no hurry to lock in profits as they expect Bitcoin prices will continue to rise, with bears losing ground.
From the graph, you can see that the candlesticks of the recent 4 hours have been closed above the 9-day Moving average. The rise of the exponential moving average (EMA) ribbon indicates that the bulls are in control. Breaking the all-time high of $50,000 and standing firm at $51,000 are signs of a big bull market.
We can see that the price is currently in the upward channel and is testing the pressure line of the upward channel. If the bulls can push the price above the upward pressure line to about $54,000 in the next few days, then BTC/USD may quickly spike to 60,000 US dollars.
Currently, short positions may intervene, and retail traders may attempt to sell their position and lock in profits. If Bitcoin’s price falls below $50,000.00, then the first support level to look for is the 20-day moving average, which is pinpointed at approximately $44,391. If the short positions bring the price below $44,391.00, then a downward trend may begin for Bitcoin and extend to the 50-day moving average of $37,973. A break below $37,973.00 will indicate that a bear market will begin.
Source: TradingView
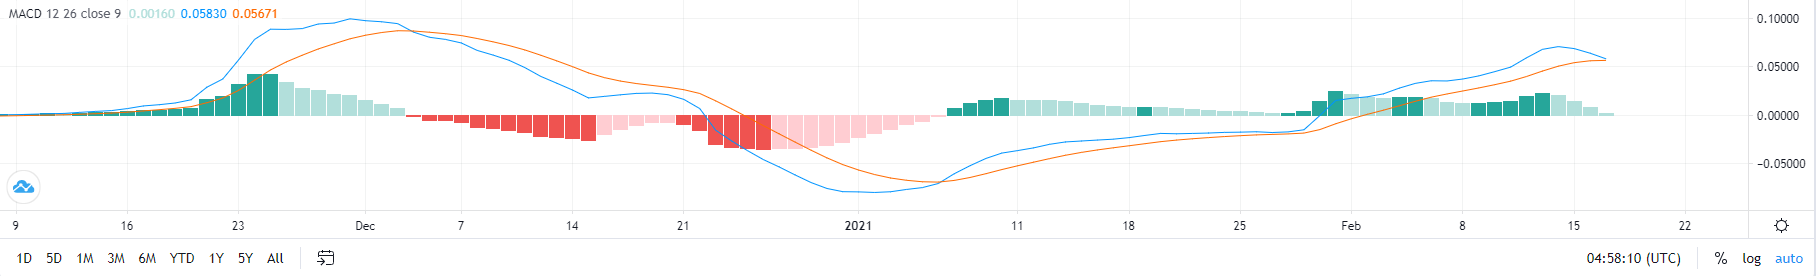
It can be seen from the Moving Average Convergence Divergence (MACD) chart that the blue line has begun to turn upstream, surpassing the yellow signal line with an increase of opening amplitude. This helps consolidate the formation of a short-term bull market.
ETH/USD
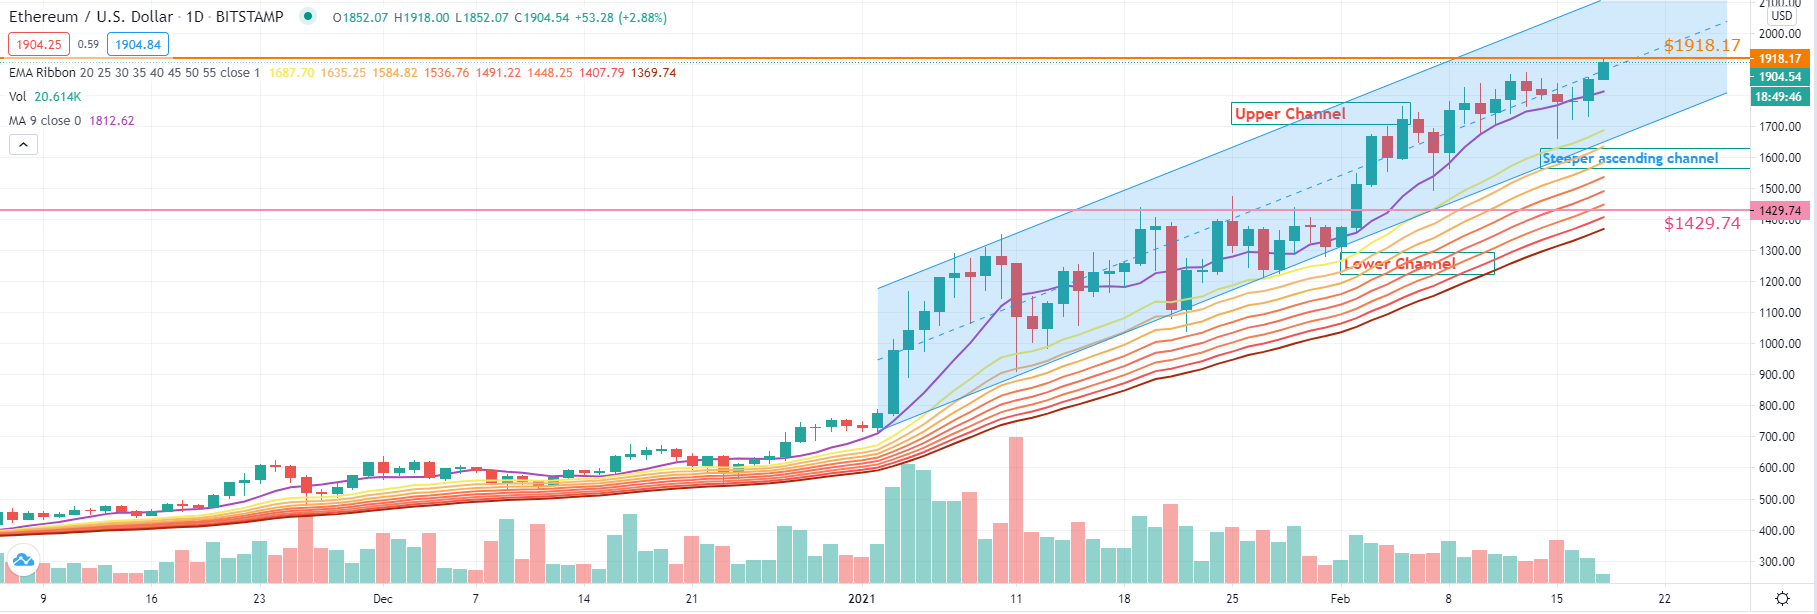
Source: ETH/USD via TradingView
Judging from the four-hour candlestick chart of Ethereum, Ether (ETH) is currently being converted within the uplink and has recently fluctuated between $1660 and $1918. At the moment, the price of Ethereum is in a state of price discovery, and buyers are trying to push the price above $1920.
If a surge above $1920 is successful, Ethereum’s price will undergo an upward trend with a target mark of $2,000, which is an important psychological barrier. If the bulls manage to push ETH’s price above the channel of $2,000, then the cryptocurrency’s momentum may accelerate.
The next pressure level will then be $2,500. To completely overcome this resistance level, the price will need to rise above about $1918, after which horizontal adjustments will be made near this level as the struggle between long and short positions determine Ethereum’s final direction.
If Ethereum’s price fumbles from its current level of around $1800.00, a break below the 20-day moving average of $1,687.5 will be the first indicator of weakness. If it breaks below $1,687.50, then $1,429.74 will be the next support point.
DOT/USD
Source: DOT/USD via TradingView
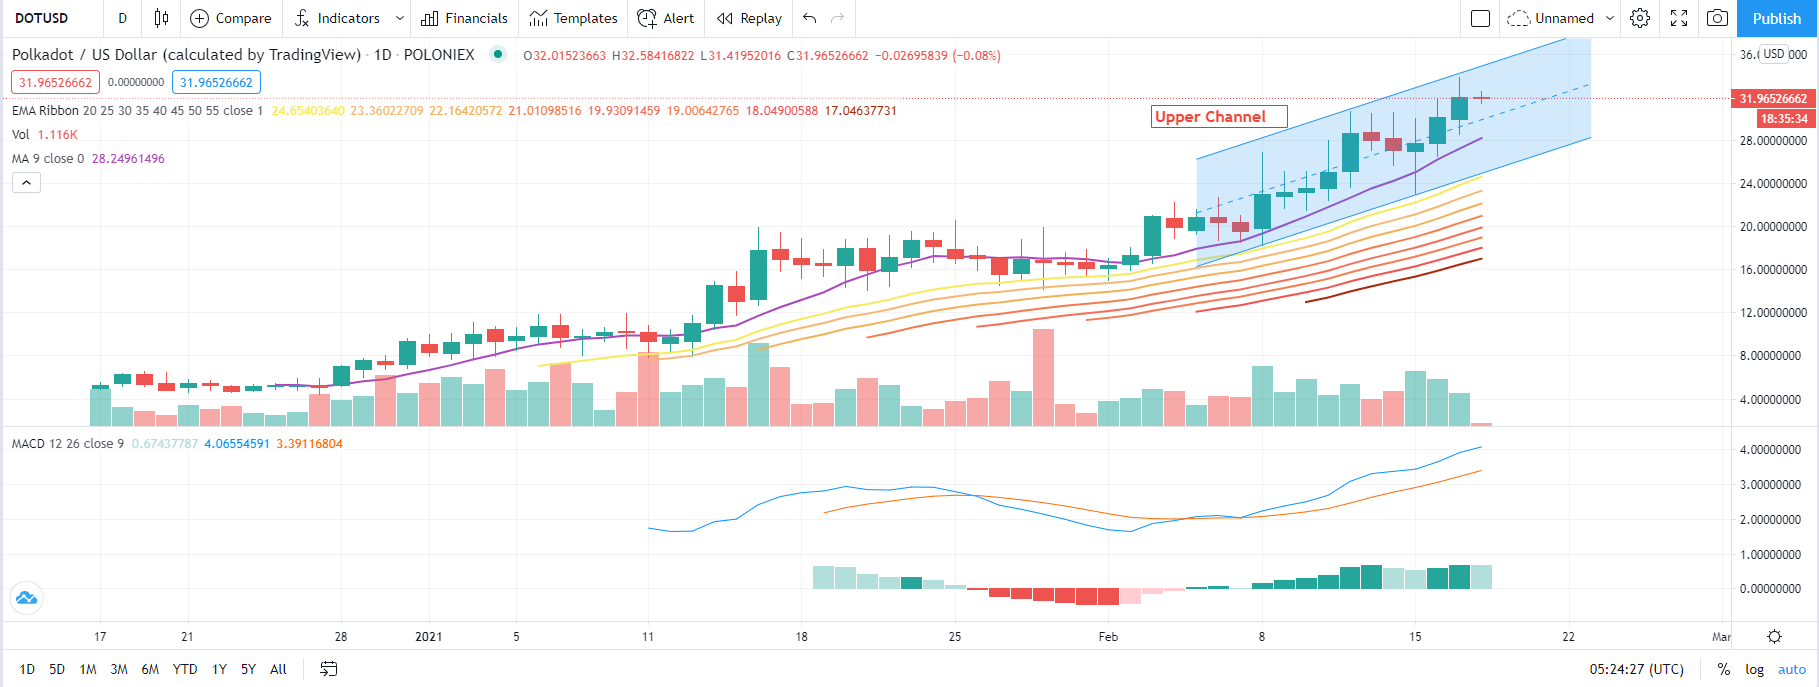
The price of Polkadot rose to a record high on February 17, which shows that the bulls are in control of the entire market, reaching an all-time high of $33.89 and closing at $31.99. As can be seen from the MACD diagram, the blue MACD line has already crossed the yellow signal line from bottom to top, forming a golden fork. The opening range is currently expanding without any signs of a decrease in transaction volume. This is proof of the future upward trend of DOT’s price.
However, although DOT’s bull run seems likely to continue, yesterday’s candlestick pattern indicates through the long upper shadow line in the graph that bears are trying to counter the price increase.
If the bulls can push the price above the upward pressure line of the ascending channel, the momentum may accelerate, and the DOT/USD currency pair may rebound quickly to around $40. If DOT/USD encounters strong resistance when it touches the pressure line of the upward channel and rebounds downward, investors do not need to worry too much as long as the price remains in the upper half of the channel. This proves that the price of Polkadot will still gradually rise, but at a slightly slower rate.
If the price falls below the midpoint of the channel, it will be the first sign of weakening momentum, and the price will touch the 9-day moving average and then test the support line of the downward channel downward, which is an essential support level, as a break below this level may indicate a change in trend.
Image source: Shutterstock