Ethereum Falls Below the Short-Term Upward Trend Line - What’s Next?
With the downturn of the entire crypto market, Ether’s price has also fallen below the short-term upward trend line.

The three Ethereum ETFs approved by Canada last week will officially begin trading on the Toronto Stock Exchange (TSX) today.

All three ETFs directly invest in Ethereum (the cryptocurrency used on the Ethereum network), which would allow investors to buy into the ETF without going through the complicated process of trading Ether itself.
However, this news did not stimulate prices to rebound. With the downturn of the entire crypto market, Ether’s price has also fallen below the short-term upward trend line, and buyers are struggling to support it. The bull and bear sides are actively competing for the dominant position of the 20-day Moving Average support of around $2,156.
Ethereum, the second-largest cryptocurrency with a market cap of $$244,838,861,145, has decreased by 5.22% with 24 hours and 2.06% in a week.
Ethereum(ETH) Price Analysis
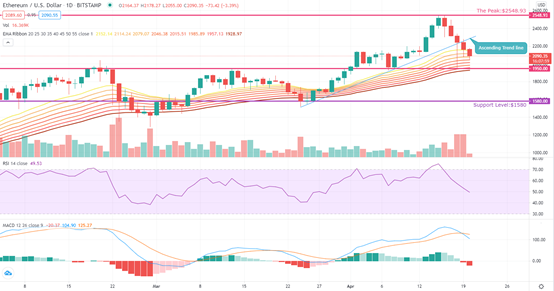
Source: ETH/USD Daily via TradingView
After Ethereum (ETH) hit a new historical high on April 16, it showed a downward trend and a strong selling appeared last Sunday, pushing the price down to around 50-Exponential Moving Average (EMA) of around $1,952. Although bulls were struggling to push prices above the uptrend line, the bears were strong and broke the uptrend line the next day, as shown on the chart.
The bears are sparing no effort today to push the price down to the 20-EMA support line. At press time, ETH is trading at $2,084.
Both the bearish MACD and Relative Strength Index reaching the equilibrium point downwards indicates that the bears are currently dominating the market.
If the bears succeed, then ETH/USD trading pair will soon fall below the $2,000 mark. In regards to Ethereum's trading volume, there is not a lot of buying support for $2,000. ETH/USD is very likely to test the 50-day moving average of $1,957.
A break below the 50-day EMA will trigger an intensified sell-off, which may lead to a drop to the support level of $1,580.
Contrary to this assumption, if the currency pair rebounds from the current level, it indicates strong buying on dips. If the ETH’s price can stand above the upward trend line, then the bulls will try to push the price to a record high of $2,548.93.
Image source: Shutterstock