Ethereum (ETH) Price Analysis - March 25, 2021
Stratis, a company based in London that provides blockchain-as-a-service (BaaS) to eliminate the complexities associated with launching a decentralized chain, announced that it was now interoperable with Ethereum. Meanwhile, how is Ether performing on the market?

On March 24, 2021, Stratis, a company based in London that provides blockchain-as-a-service (BaaS) to eliminate the complexities associated with launching a decentralized chain, announced that it was now interoperable with Ethereum.

The implementation of this operation is designed to help global enterprises access blockchain services while enabling the company to use Stratis Technologies' ease of use to attract millions of Ethereum users.
As decentralized finance (DeFi) products continue to receive attention, they are showing exponential growth. This phenomenon has accelerated the development of Stratis' interoperability solutions. Stratis InterFlux will provide interoperability between the Stratis (STRAX) blockchain and the Ethereum blockchain, introducing wSTRAX into the Ethereum blockchain.
Ethereum(ETH) Price Analysis
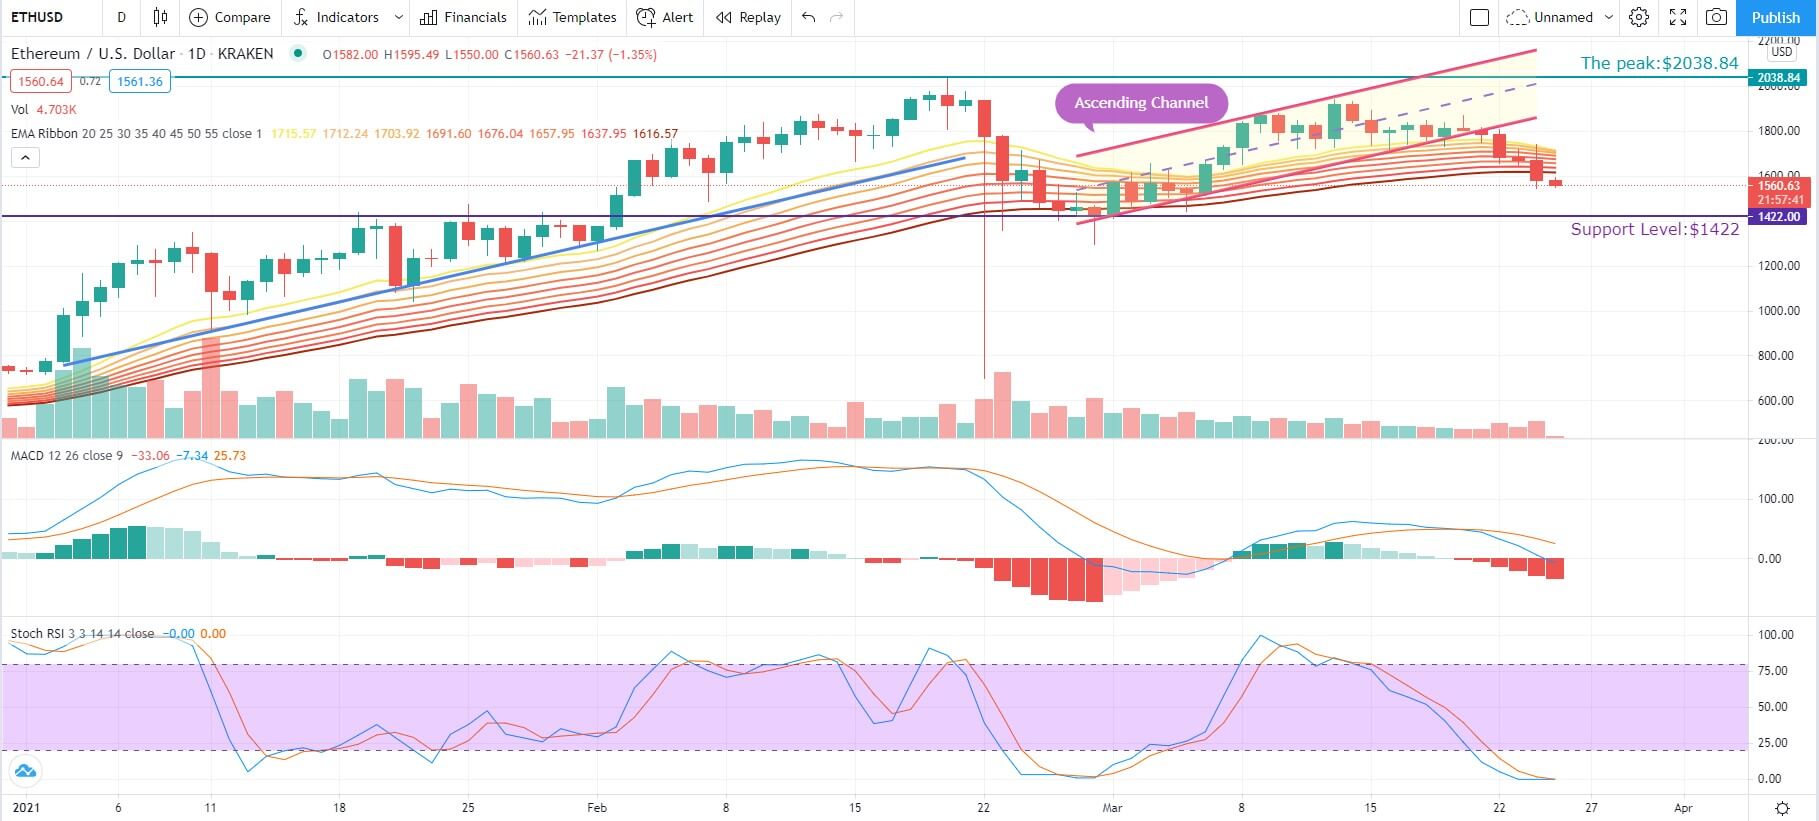
Source: ETH/USD Dailly via TradingView
Judging from the daily candlestick chart, the price of Ethereum (ETH) has fallen below the ascending channel drawn in the figure, succumbing to the selling pressure. Ether fell below the Exponential Moving Average ribbon on March 24.
The bulls are currently struggling to push the price back above the moving average and send Ethereum on an upward trend. At the time of writing, Ethereum is trading at $1,575.
The MACD indicator has formed a bearish crossover. The blue MACD line and the yellow Signal line have both been dipping downwards below the zero axes. The downward sloping moving average indicates that the short-term market is still dominated by the bears.
An important support level for ETH is pinpointed at approximately $1,422. in terms of trading volume, it is still relatively small compared to the previous decline from February 22 to February 28. The stochastic RSI indicator has been glued at the 0 point in the oversold zone, which is an indication that a bullish crossover will potentially be formed in the short-term. After that, the stochastic RSI indicator will rise from 0 and jump up by 20 mark, out the oversold zone. Ethereum's price will usher in a corresponding rebound. Therefore ETH may rebound above $1,422.
If the ETH/USD continues to decline and hits $1,400, then ETH/USD is likely to fall to $1,295.
If the buyer succeeds in pushing the price of ETH above the 20-Exponential Moving Average of $1,717, ETH/USD may try again to reach its all-time high of $2,038.34. Breaking and closing above this resistance level of $2,038.34 can result in the resumption of an upward trend, and the next target for Ethereum will then be $2,500.
Image source: Shutterstock