Cardano (ADA) and NEM(XEM) Price Analysis – March 10,2021
Despite the crypto market being generally bullish at the moment, altcoins have differed in their performances. Cardano (ADA) and NEM (XEM) for example, have had completely different trajectories.

As Bitcoin has soared in the past week and has touched the psychological barrier of $55K today, most virtual currencies have risen as well. Despite the crypto market being generally bullish at the moment, altcoins have differed in their performances. Cardano (ADA) and NEM (XEM) for example, have had completely different trajectories.

Cardano, with a market cap of more than $37,494,584,458, is currently ranked fourth. The altcoin has fallen by 5.45% in the past 7 days. As for NEM, it has become the virtual currency with the largest decline, as high as 22.72% within 7days.
Cardano(ADA) Price Analysis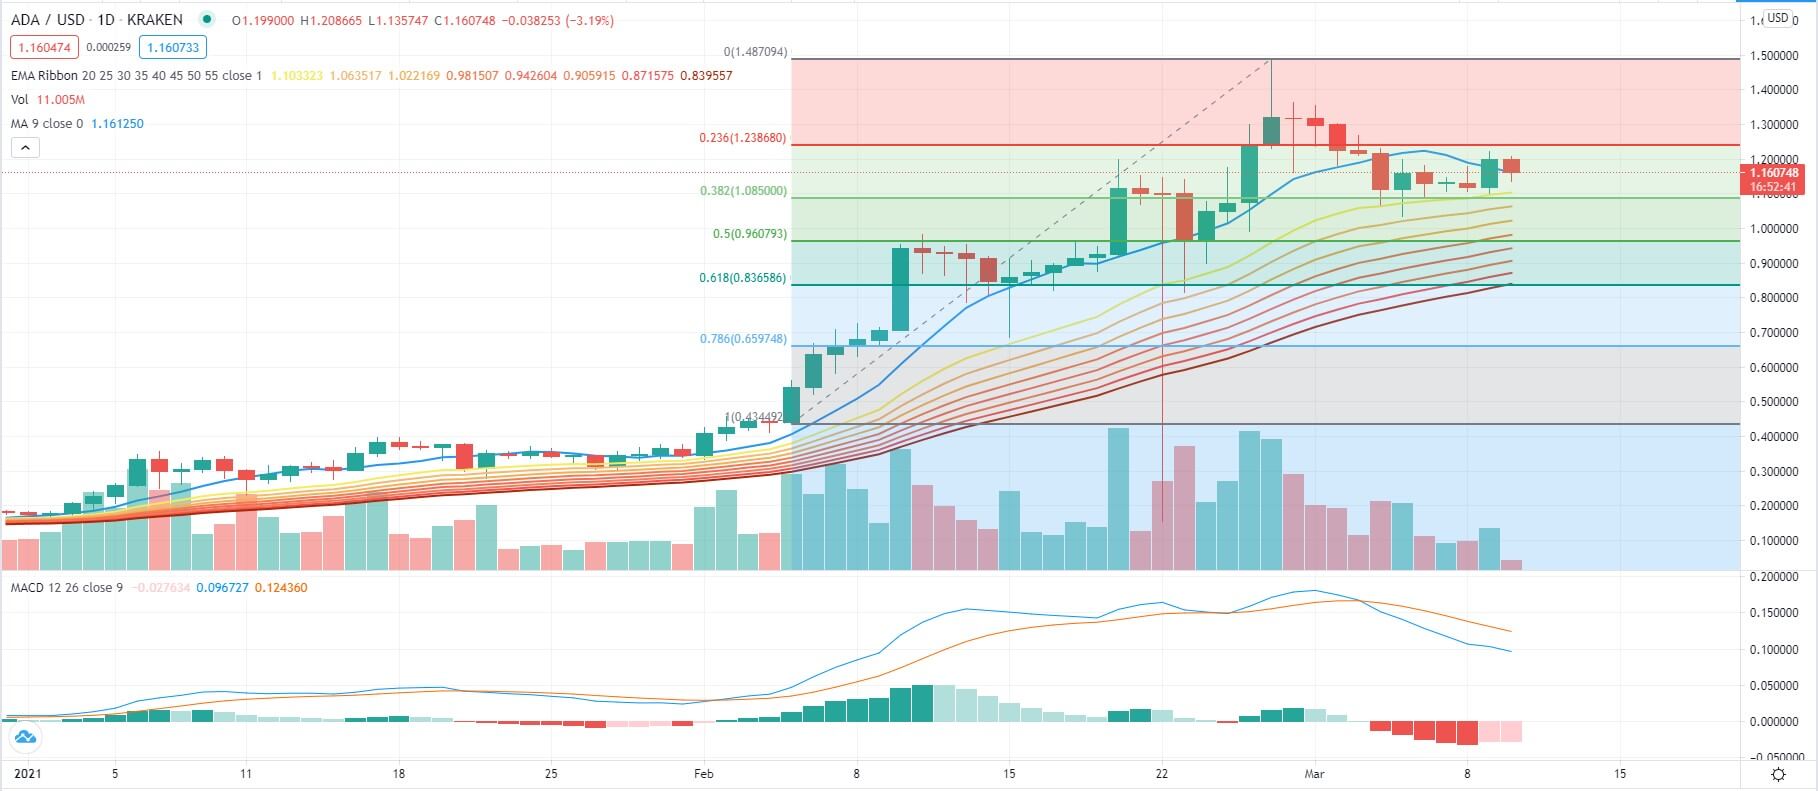
Source: ADA/USD Daily via TradingView
From the daily candlestick chart of Cardano(ADA), it can be observed that ADA has been on a downtrend since its rise to a new all-time high (ATH) of $1.485 on February 27. At the time of writing, ADA is trading at $1.1621.
Although ADA's chart indicates a pattern of candlesticks that have all closed above the 20-day Moving Average line for the past four days, a shrinking trading volume can be observed. This means that the bulls have failed to prompt a strong rebound for ADA.
It can be seen from the MACD chart that the blue MACD line has already crossed the signal orange line, forming a death cross. Since there is currently a lack of active buying, the price of ADA will continue to undergo a downward trend in the short-term.
From a technical perspective, according to the Fibonacci Retracement levels that indicate where support and resistance are likely to occur, the bears may now manage to push ADA's price to the 20-day moving average support level of around $1.10. If ADA fails to sustain itself at the $1.10 level, the altcoin may move downwards to $1.08. If ADA breaks down from $1.08, it may fall to a 61.8% level Fibonacci Retracement level of $0.8365, a clear bearish signal.
However, if ADA manages to rebound higher from $1.10, it may retest its previous high of $1.48.
NEM(XEM) Price Analysis
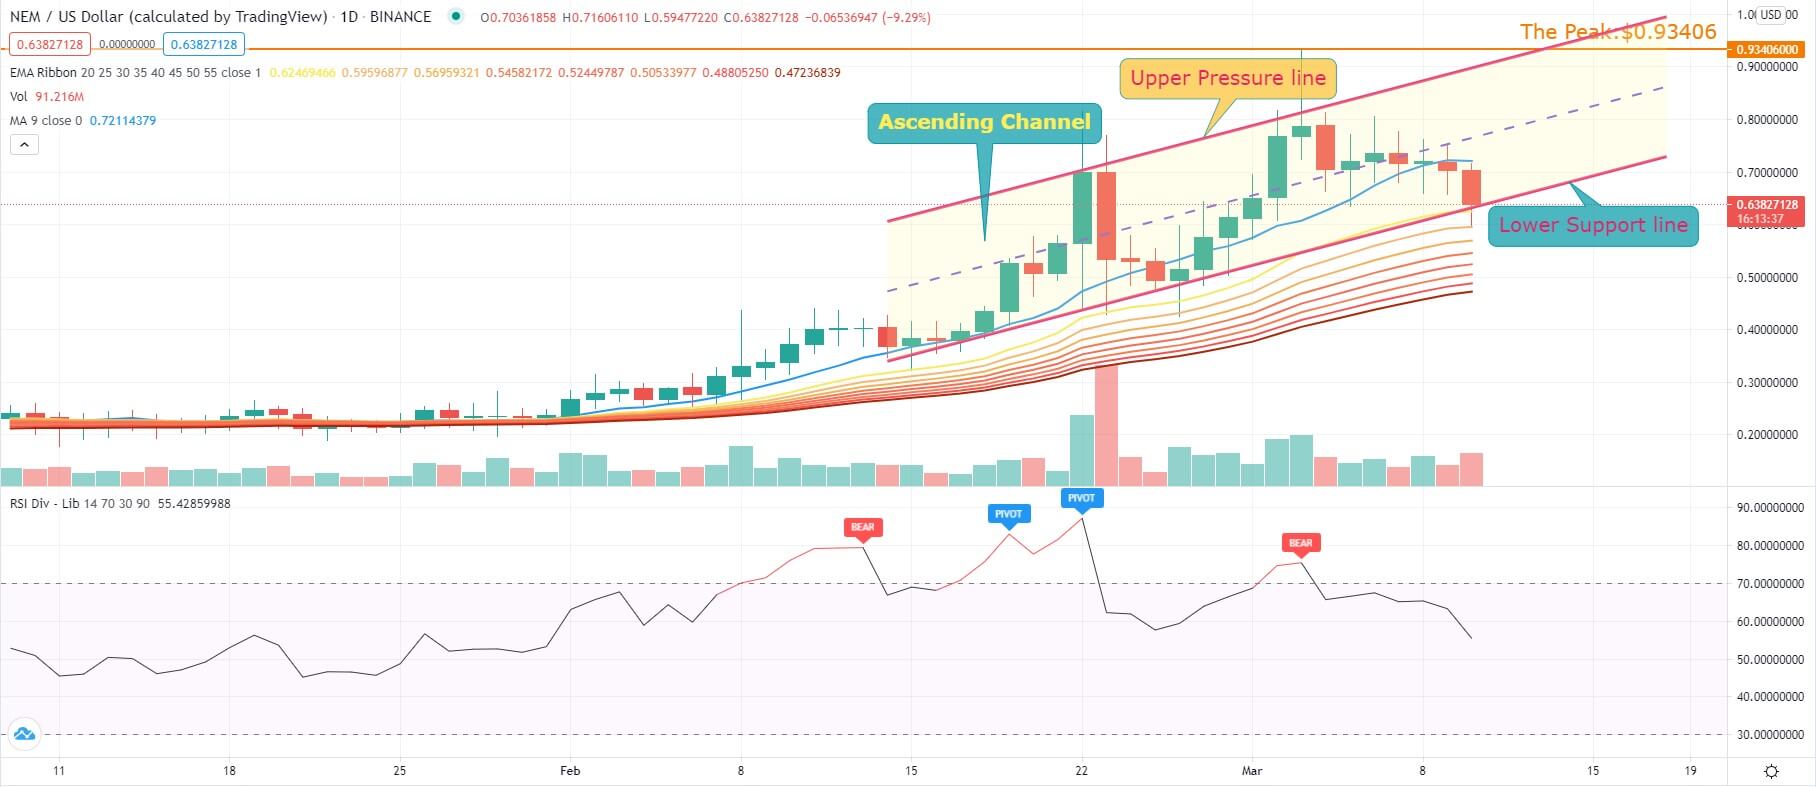
Source: XEM/USD Daily via TradingView
It can be seen from the daily candlestick chart of NEM(XEM) that since the highest point of $0.93406 was created on March 3, the broader market correction has hurt the price of NEM, which has dropped by 23.54% in the past 7 days and by 10.55% in 24 hours. At the time of writing, NEM is trading at $0.6414.
Although XEM is showing a downward trend, the rebound of the cryptocurrency from its various support levels such as the exponential moving average ribbon on the chart shows that XEM is still in a healthy upward trend within the ascending channel we draw in the figure.
Currently, the bears are retesting the 20-day Exponential Moving Average around $0.625 level of support and are doing their best to push the price out of the rising channel. Therefore, whether it can close above the lower support line of the rising channel today will be crucial.
From a technical perspective, RSI points downward from the 60 mark. In the short term, it should still be in a short-lived bearish market. The first support level is the 20-day Exponential Moving Average. If XEM can stand over $0.625, then the bulls will still control the whole market and the price will not correct sharply.
If the bulls fail to maintain this level, then the bears will suppress NEM's price, forcing it to test the next support level 50-day of $0.48821, which is the 50-day Exponential Moving Average.
Image source: Shutterstock