Bitcoin Price Could Drop in the Short Term As BTC Consolidates at $46K
The Bitcoin price traded to a new all-time high at $48,308 before correcting lower and now appears to have hit a short-term downward trend. Where to next for the BTC price?

The Bitcoin price traded to a new all-time high at $48,308 before correcting lower and now appears to have hit a short-term downward trend consolidating at the $46,000 level. Where to next for the BTC price?

Following its new ATH, Bitcoin suffered a downside correction below the $47,000 level. The price even traded below the $46,000 level, but it remained stable above $45,000. A low was formed near $45,084 before the Bitcoin price recovered higher.
BTC is currently trading at $46,663.43 down 2% in the last 24hours and our analysis indicates Bitcoin could move lower if it fails to clear the $47,000 resistance.
Bitcoin Price Analysis
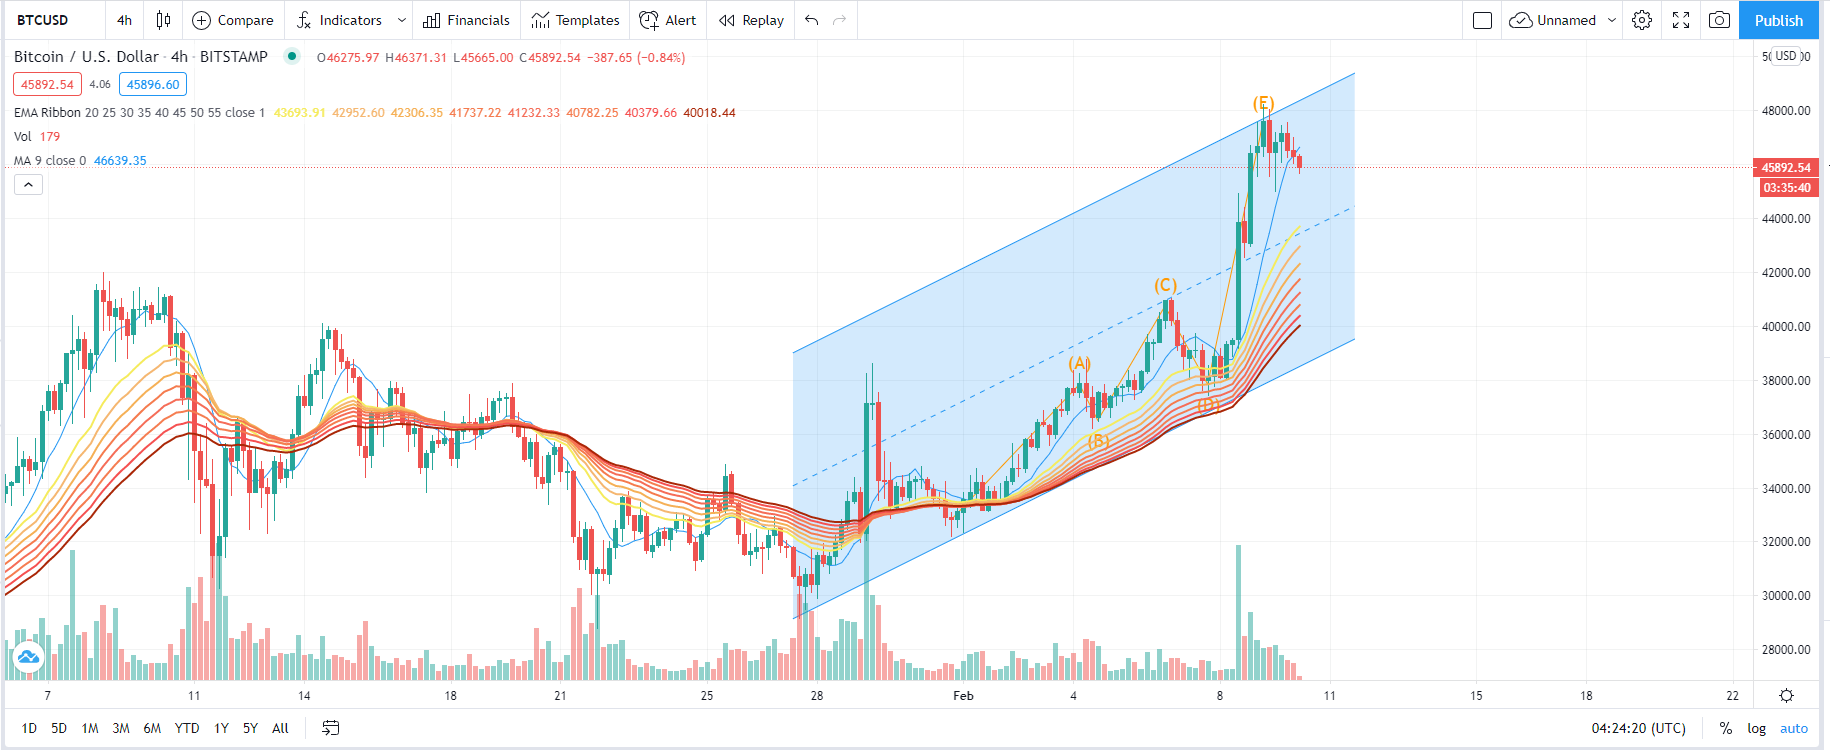
Source: BTC/USD TradingView
According to the 4-hour Bitcoin price candlestick chart, it can be seen that the current Bitcoin price is in an ascending channel, and the candles in the last 4 hours have all closed above the exponential moving average ribbon (EMA) and a series of exponential moving averages of different lengths show a long array—which helps confirm a rising BTC price trend. However, it is worth noting that the last few 4 hr candlesticks closed below the 9-day Moving Average. In the following 4 hours the BTC price will test the 20-day Moving Average and should move downward in the short term.
According to the Elliott Wave Principle, as shown in the figure, the high point of the fifth wave, point E, has been formed. In the short term, the price will retrace downwards, and it is currently in the wave A callback channel.
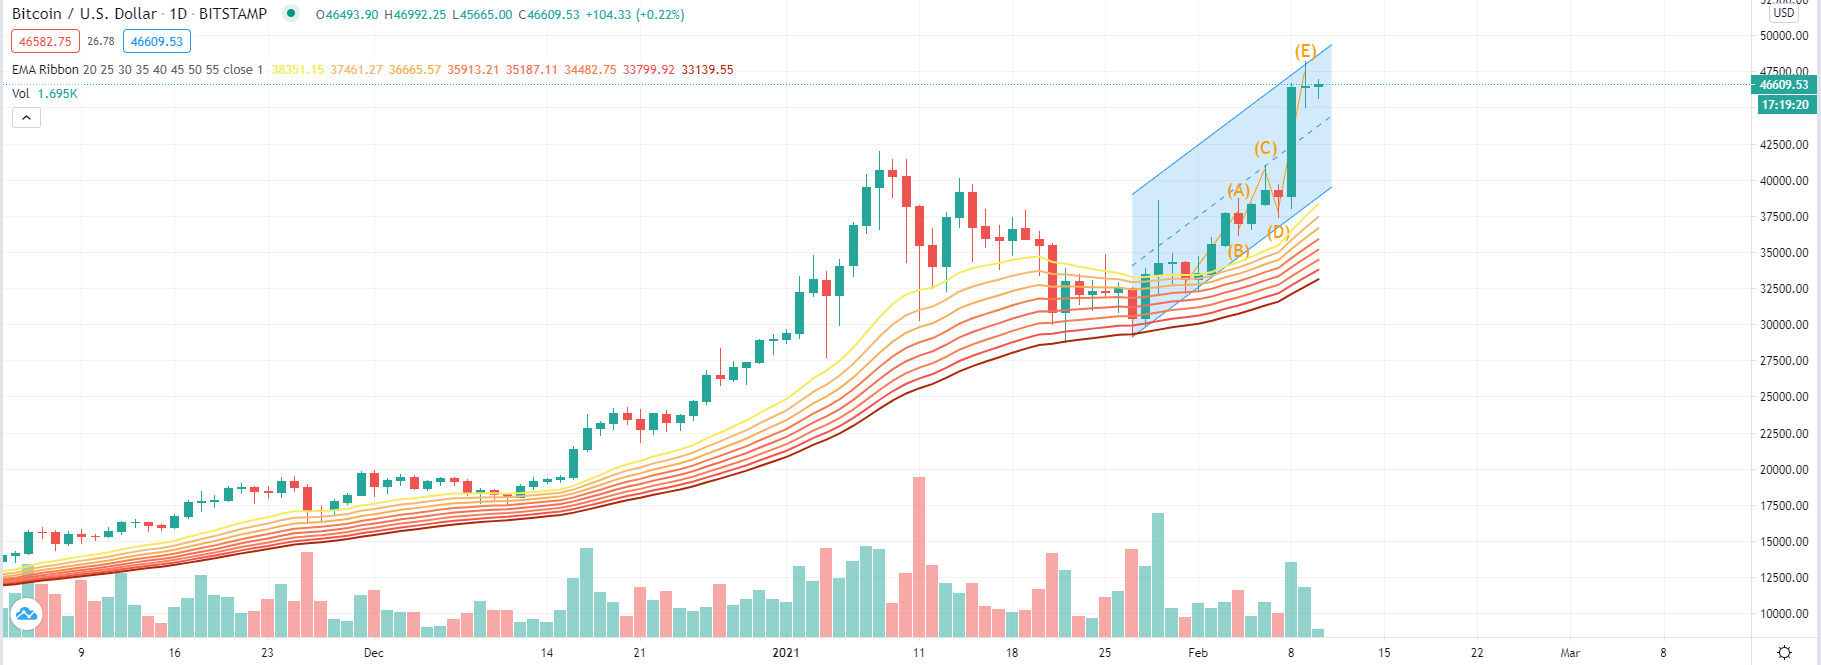
Source: USD/BTC TradingView
From the daily chart, it can be seen that two Doji Candlestick patterns were formed—one on February 9th and again today on February 10th. The formation of the Doji indicates a struggle between the buyers and sellers are fighting fiercely and it is difficult to distinguish the winner as it touches the upper channel which is in itself indicative that the trend could reverse from the strong selling power of the upper-pressure line resistance. In the short-term Bitcoin’s price will likely move lower towards $44,000.
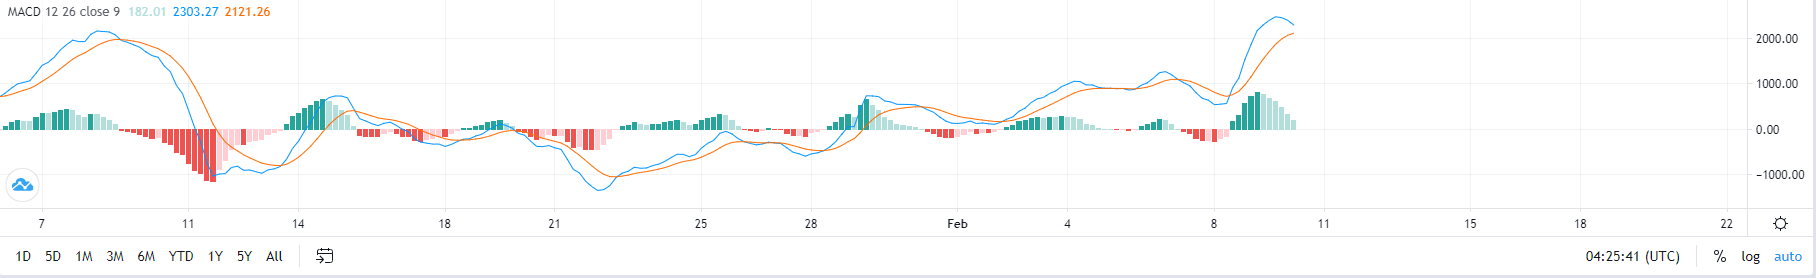
Source: USD/BTC TradingView
It can be seen from the MACD chart that the MACD line(blue) has begun to trend down and is approaching the signal line (yellow) and the opening of the two lines has shown a shrinking state with a constantly decreasing transaction volume. This is a precursor to the formation of a dead cross and would again show a short-term bearish market.
Overall, Bitcoin is still showing significant strength and should continue its bull run after what we expect to be a short-term downtrend over the next two days for the BTC price.
Image source: Shutterstock