BCH Price Sees a Bullish Correction After A Week-Long Dip, Chainlink (LINK) Still On a Downtrend
This article reviews the short term price analysis of altcoins Bitcoin cash (BCH) and Chainlink (LINK) as the overall crypto market continues to move bearishly sideways.

A look at the current price movement of Bitcoin Cash (BCH) shows similarities with that of Bitcoin while Chainlink (LINK) is failing to correct its current week-long losses.

The cryptocurrency market has been on a general bearish trend for the past one week with little unpromising corrections currently been registered. The current run of the market appears to be in correlation with the price of Bitcoin (BTC) which has recorded a slight loss of 0.03% in the past seven days according to CoinMarketCap.
Although Bitcoin is beginning to correct its losses at the time of writing, it is currently trading at $19,202.78, a price below its newly recorded all-time high price of $19,800.
Bitcoin Cash (BCH) Price Analysis
The Bitcoin Cash market has seen a struggle of dominance between the bulls and the bears as evident in the coin’s snapshot price for the past one month. The market was under the control of the bulls about a month ago as data from Coingecko shows a 7.6% rise in price that month. In the days following, the bears pulled the price back down with a 12.9% dip two weeks ago.
The coin is currently up 0.9%, an attempt to regain the 2.9% loss recorded a week ago. Per the technicals, the Bollinger Bands shown in the BCH-USD chart show a very volatile market but currently more in favor of the market bulls.
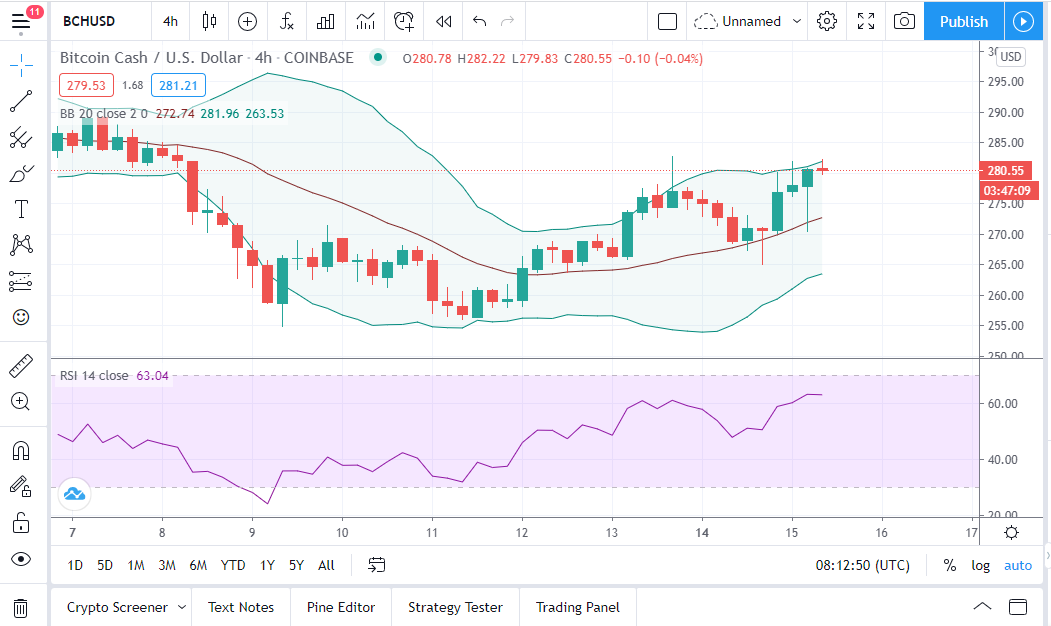
Source: TradingView
The 20-day Moving Average of the Bollinger Bands shows a midway retrace from the 11th of December, after the better part of the month has been on a downtrend. With the price moving towards the upper bands, and the RSI currently above the neutral zone, the odds are in favor of the bulls to control the market in the short term.
Chainlink (LINK) Short Term Price Analysis
Chainlink (LINK) remains among the top 10 cryptocurrencies that have failed to show signs of a bullish correction in the past seven days. The strong bear action has sent the price of LINK down by 11.4% in the past 14 days, 3.7% in the past week, and 1.1% in the past 24 hours. This dip in price contradicts the strong potentials of the LINK token, a coin that has gained 531.1% in the past year according to Coingecko.
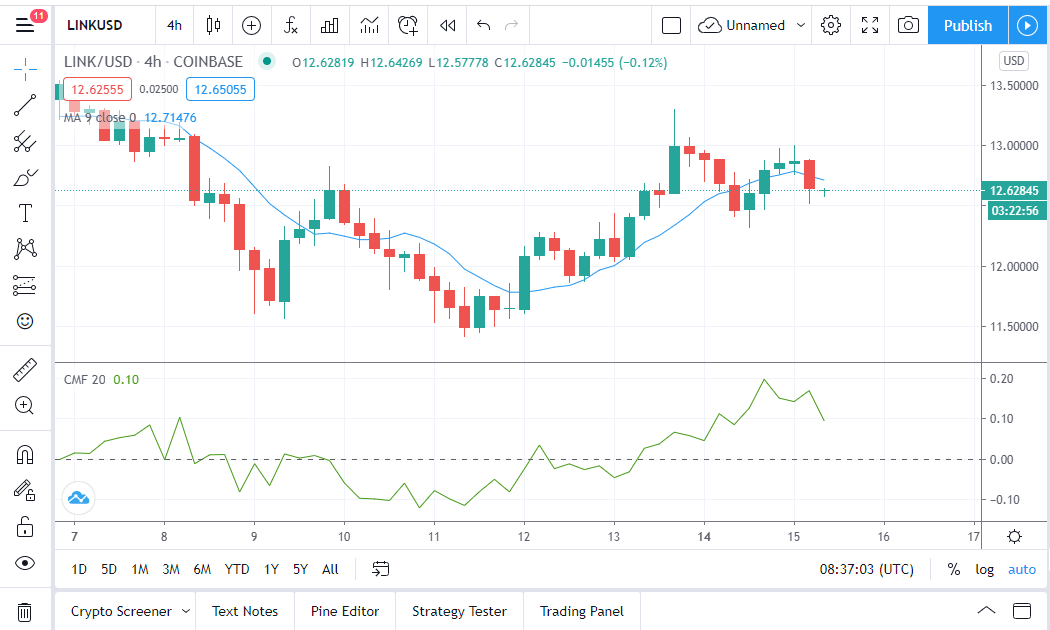
Source: TradingView
The technicals are somewhat suggesting different trends on the short-term price projection of LINK. While the Chaikin Money Flow (CMF) indicator shows a growing bullish momentum, the tail end of the 20-day Moving Average suggests a near-bearish run. However, the LINK market with these divergent indicators shows that both the bears and the bulls are trying to gain control of the market as confirmed by LINK’s current RSI of 52 at the time of writing.
Image source: Blockchain.news